



Introduction — a simple question with numbers behind it
Have you ever stood at a depot and watched a bus line clear faster than expected—and wondered why some fleets still lag behind? In many cities, the pivot to pantograph charger systems has cut dwell time and increased uptime by measurable margins (we’re talking double-digit percent gains in utilization). I say this because I’ve seen maintenance logs and KPIs—raw numbers that tell a clearer story than marketing slides.
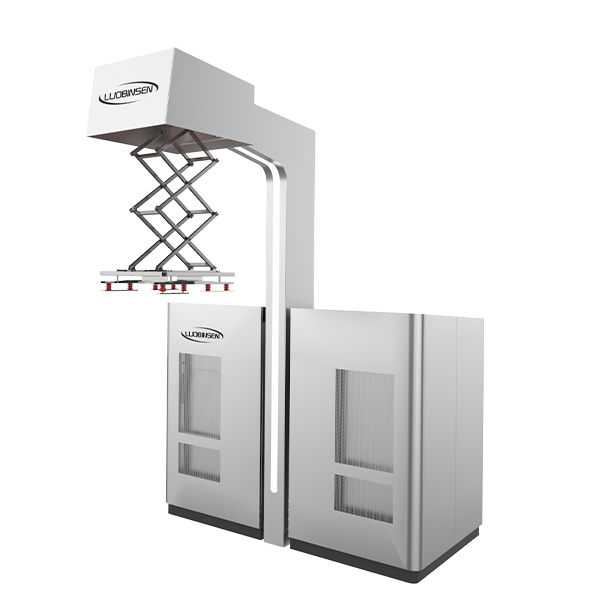
Here’s the scene: a busy route, tight headways, and the challenge of delivering reliable recharges without delaying service. A pantograph charger sits above a bus, connects quickly to the roof-mounted current collector, and pushes energy back into the vehicle’s battery. Simple in concept, the execution is where complexity hides—power converters must behave, contact strips must align, and software must coordinate the handshake. So, how do we move from an idea that works on paper to a solution that works every shift? (that’s the question I keep asking operations teams)—and yes, the data matters.
In the sections that follow I’ll compare what many operators tried, why some routes still suffer, and what practical choices make the difference. Let’s move from the scene to the mechanics.
Where traditional systems break down: a technical look at practical flaws
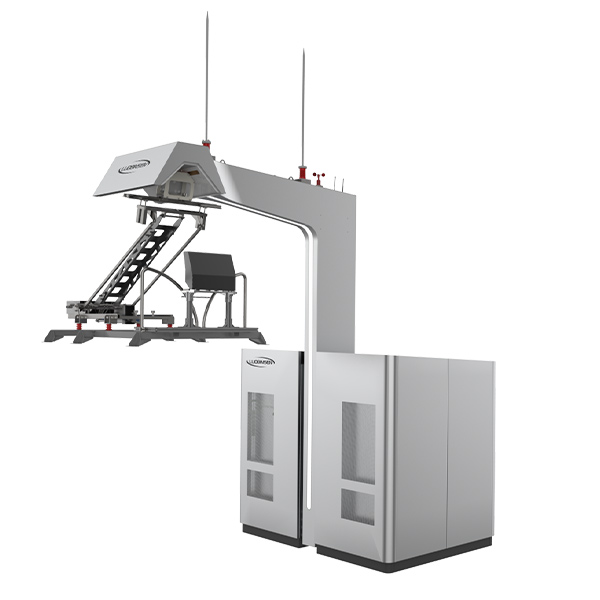
pantograph bus charger installations often fail for reasons that aren’t obvious on commissioning day. I want to be blunt: many failures are not electrical alone. They come from mismatched control logic, poor mechanical tolerances, and software that treats the charger as a black box. From my hands-on reviews, I see recurring issues with contact strip wear, misaligned current collectors, and converters that overheat under transient loads. Those are engineering problems—but they’re also people problems. We underestimate maintenance windows and overestimate human repeatability.
Technically speaking, the handshake between charger and bus involves communication frames, pre-charge sequencing, and protection trips. When the control stack doesn’t sync with the on-vehicle battery management system, you get aborted cycles and wasted energy. Add edge computing nodes that are poorly updated, and remote diagnostics become guesswork. Look, it’s simpler than you think: if the firmware and mechanical guide rails aren’t designed together, availability drops. — funny how that works, right?
Why does this keep happening?
Often because procurement separates hardware from software. One vendor supplies the pantograph arm, another supplies the power converters, and a third writes the control software. Integration tests are rushed. And when problems surface in cold weather or high humidity, the root cause is already buried in a chain of vendors. So we need to prioritize integrated validation—mechanical, electrical, and software at once. That reduces surprises and gives operators a predictable uptime curve.
Looking ahead: principles, real cases, and 3 metrics to guide your choice
When I think about the next wave of improvements, I focus on principles rather than features. The first principle is modular reliability: design the pantograph for maintainability so a worn contact strip is a quick swap, not a depot outage. The second is communication transparency: the charger, vehicle BMS, and depot systems must share clear telemetry. The third is adaptive power control—power converters that can modulate output based on state-of-charge and route timing. In practice, these principles played out in a recent pilot I visited where a controlled integration between charger controls and fleet management reduced failed charge attempts by more than half. That was no accident; it followed a disciplined integration plan.
Now consider “pantograph for electric bus” in future deployments—think smarter site design, standardized mechanical interfaces, and layered diagnostics. Operators should demand end-to-end test reports and firmware traceability. Semi-formal? Yes. Practical? Absolutely. We can compare vendors on how they test for alignment drift, how they validate thermal behavior in converters, and how quickly they push OTA fixes. — and that second point matters a lot when you have a hundred buses to keep running.
What’s Next — three metrics I use to evaluate solutions
Here are three concrete, measurable metrics I recommend you use when choosing or auditing a system: 1) Mean Time Between Interventions (MTBI) for the pantograph arm and contact strip; 2) Successful Charge Rate—the percent of scheduled charges that finish without manual intervention; 3) End-to-End Latency from connection request to power flow (this picks up control and communication bottlenecks). Track these over several months and you’ll see the difference between a polished system and one that’s just promising on paper.
In the end, I believe the best decisions come from practical tests, honest data, and a readiness to integrate across disciplines. We’ve learned to stop assuming software will retrofit mechanical flaws; it rarely does. For operators seeking a dependable partner, review integration history and insist on field-proven solutions. For those exploring suppliers, consider starting small with a focused pilot that targets these three metrics. You’ll save time, reduce surprises, and get buses back on the road faster. For further technical resources and product details, see Luobisnen.