



Introduction: The Real Differences Show Up Under Load
Capacity, round-trip efficiency, response time—these decide whether your project breathes easy or coughs at peak demand. Many energy storage battery companies will quote the same watt-hours, the same glossy cycle counts. I have over 17 years in the B2B energy storage supply chain, and I learned the hard way that the supplier choice is an engineering decision, not a brochure comparison. When I sit with a client to shortlist an energy storage lithium battery supplier, I start with failure modes, not price tags—because rupees lost to downtime do not return, ji.

Last summer, in Lahore’s Sundar Industrial Estate, a 5 MWh system lagged during a heat spike; two power converters throttled, the BMS threw conservative limits, and the site lost 11% throughput for three days. These energy storage battery companies weren’t dishonest; their lab data just didn’t match field conditions with dusty intakes and 47°C ambient. The data? A 92% round-trip efficiency on paper slid to 87% in the field; response at edge computing nodes stretched from 240 ms to 600 ms during grid flicker. Why does this happen, and what can you do about it (besides praying the DC bus holds steady)? The deeper issue isn’t capacity; it’s how a supplier proves thermal stability, PCS harmonics control, and state-of-health tracking under stress. I prefer suppliers who publish UL 9540A test notes, offer 280 Ah or 314 Ah LFP cells with liquid cooling, and show their derating curves. That stance was not born in a classroom—it came from spending two monsoon seasons swapping clogged filters and chasing nuisance trips. Let us move toward a clearer comparison that saves time and, frankly, saves dignity on commissioning day.
Comparative Insight: Field Proof vs. Paper Promise
Two sites, same nominal 10 MWh. Different outcomes. In March 2023, we upgraded a Karachi data centre microgrid from a 2019 air‑cooled rack (2P strings at 1500 V, 60-minute C-rate) to a liquid‑cooled LFP container using 280 Ah prismatic cells. The first vendor’s datasheet boasted 6,000 cycles; the real field log showed 4,300 cycles to 80% SOH due to summer derating and uneven cell balancing. The second—an energy storage lithium battery supplier with a stricter BMS algorithm, better busbar design, and tighter PCS coordination—held 94% round‑trip efficiency with only 1.2% throughput loss during a week of 43–45°C ambient. Same MW rating, but the container with liquid cooling kept ΔT across modules under 4°C, slashing drift and calendar fade. I still remember the commissioning night: diesel backup went quiet, IT load never blinked, and the operations manager just nodded—short nod, big relief.
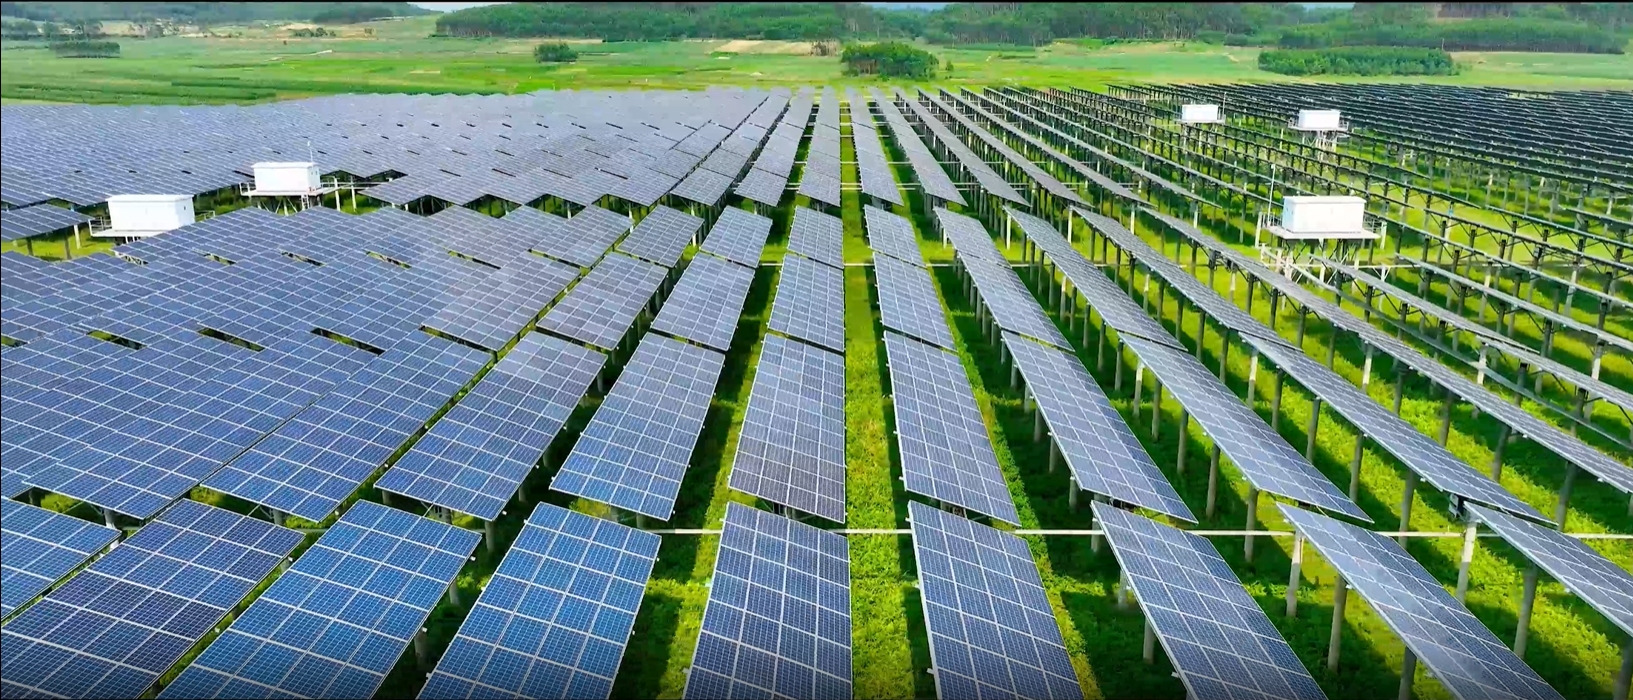
I’ve seen similar in Bahawalpur, December 2022. A 20 MWh solar‑plus‑storage farm shifted to firmware that actively tracks impedance rise per rack and re-levels via targeted top‑balancing. Sounds small, but it cut reactive power excursions by 17% and took MTTR from 3.5 hours to under 80 minutes. That is the quiet mathematics of survival in hot, dusty sites. And I’ll be blunt—any supplier evasive about heat‑soak tests or can’t share IEC 62619 and UL 9540A traceability makes my red flags flutter. My team now asks for PCS harmonic spectra under 50% partial load and demands data for SoC estimator drift after 24 hours at rest. It is not paperwork; it is self‑defence.
What’s Next
Looking ahead, two shifts will define winners: higher‑capacity LFP (314 Ah+ with low swell rates) and tighter EMS‑to‑BMS integration that rides the DC bus with fewer transients. Sodium‑ion pilots are promising for -10 to 35°C climates, but in our heat, liquid‑cooled LFP remains the practical workhorse. Expect 3.0+ MWh per 20‑ft container, integrated fire detection with aerosol suppression, and PCS that speaks fast Modbus/TCP and IEC 61850 without translation lag. The right energy storage lithium battery supplier will prove consistency: derating curves that match Pakistan’s summer grid, harmonics that stay tame when gensets start, and edge computing nodes that don’t stall during low‑inertia events—odd thing to celebrate, but that’s where projects live or die.
How I Evaluate Suppliers When Money and Time Are on the Line
Let me summarise without repeating myself: field proof beats promise; thermal discipline beats slogans; and service density near your sites beats any global logo. When I advise EPC leads and procurement managers, I pull out three checks that never failed me in Multan (July 2021), Karachi (March 2023), and Islamabad (October 2024). They look simple, but they catch real risk—fast.
- Traceable Heat Discipline: Demand liquid‑cooling performance logs at ≥40°C ambient, ΔT mapping across modules, and PCS derating curves under reactive loads. No logs, no deal.
- Actionable Diagnostics: Ask for access to raw BMS telemetry (cell impedance, SOC drift, balancing current) and EMS audit trails. If you can’t see the nerve signals, you can’t heal the system.
- Grid Behaviour Under Stress: Require harmonic spectra, ride‑through tests at 0.8 PF, and black‑start behaviour with IT loads. Numbers on a calm Tuesday mean nothing if Friday night flicker trips your breakers.
I speak like this because I have stood in switch rooms at 2 a.m., watching alarms pile up while a client’s factory line stalled at Rs 18 lakh per hour of lost output—chubti hui baat, but it focuses the mind. Choose partners who show their scars and their data. Measure them by how they behave in your climate, on your feeders, with your PCS. That is how projects stay upright and profits stay intact. HiTHIUM